
Knowledge · Solar
Thermal drone for PV: what it sees
What a thermal camera detects on a PV plant, what the patterns mean, which conditions the flight needs and where the method reaches its limits.
Published · 6 min read · by Markus Linke
A thermal camera does not measure defects. It measures surface temperature, nothing else. That this yields a usable statement about a photovoltaic plant rests on one physical circumstance: a module that can no longer turn its current into power turns it into heat. The fault therefore gives itself away, but only under certain conditions and only in certain forms. This article describes both, the visible and the invisible.
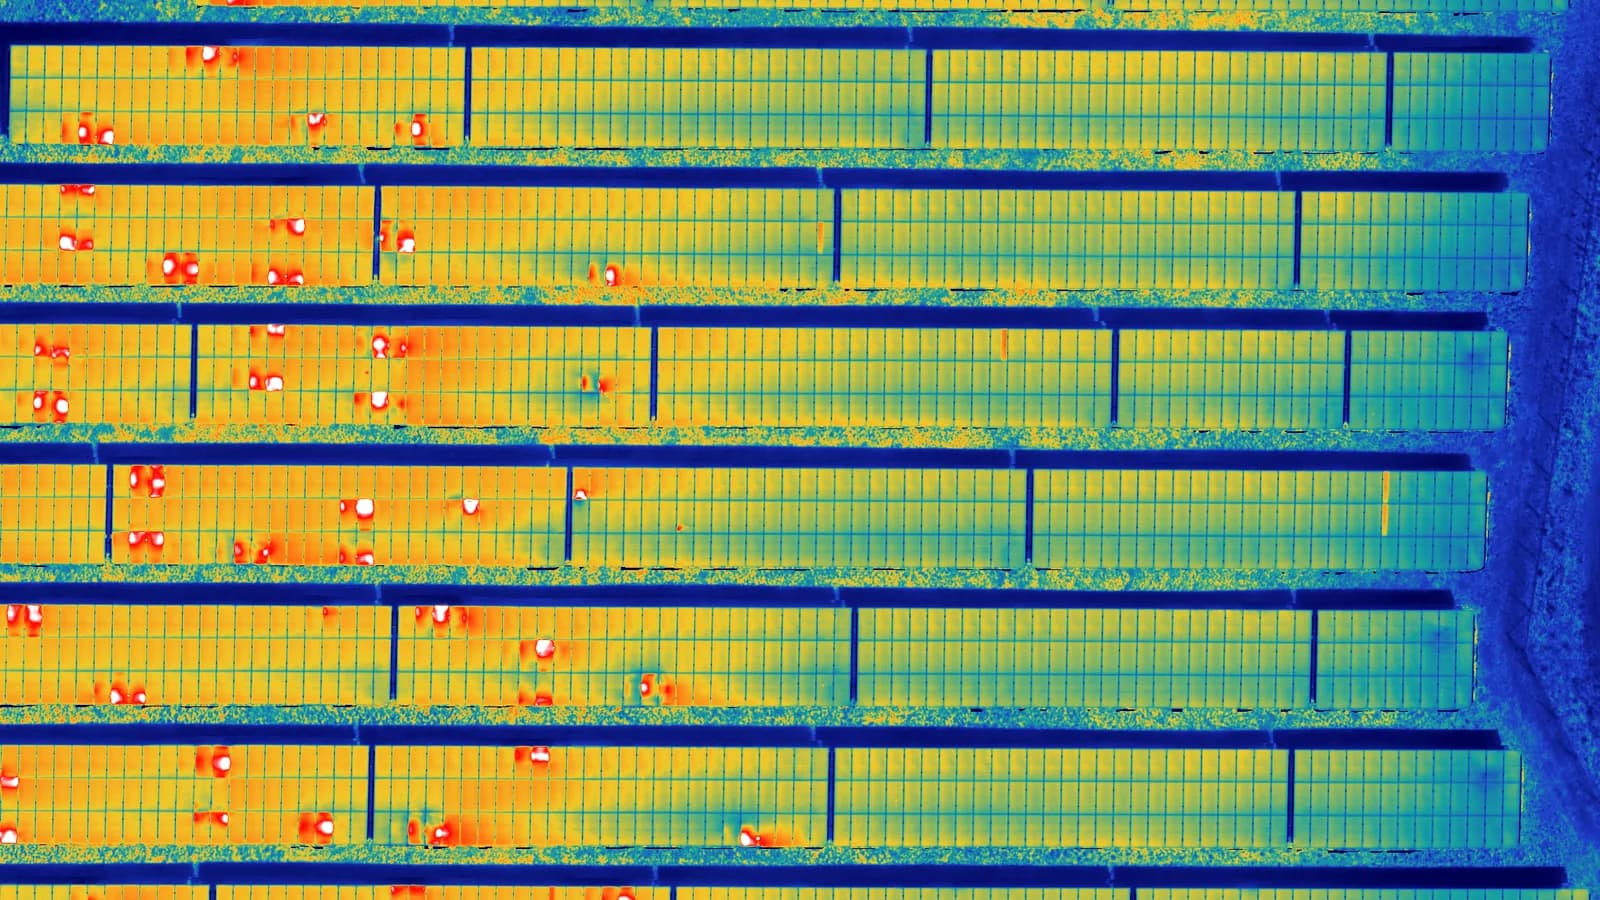
What a hotspot actually is
In a string, the modules are connected in series. The current that fits through the weakest module determines the current of the whole string. If a cell is damaged, shaded, or ages unevenly, it can no longer pass the current of the others. It becomes a resistance and heats up.
That is why a single conspicuous module depresses the yield of the whole string long before an alarm appears in the monitoring. The inverter sees the string, not the module. And it is why the plant absolutely has to be running under load during the survey: no current flow, no heat; no heat, no finding.
What the patterns mean
The shape of the warm spot says more than its temperature:
- A single bright point within a module points to a damaged cell, often after hail, mounting pressure or a cell crack with an electrical effect.
- A warm stripe across several cells usually corresponds to a bridged sub-string, that is, an active bypass diode.
- An evenly warm whole module points to a module that is no longer delivering any current at all, for instance where the connection is interrupted.
- A whole warm row or a warm table is rarely a module problem, but rather an indication about the string or the inverter.
- A pattern that intensifies towards the frame may indicate potential-induced degradation and calls for a targeted re-measurement.
This assignment is a suspected diagnosis, not a determination of cause. What is really going on is measured at the module by the qualified electrician.
What the camera does not see
Honesty pays off here, because otherwise false expectations arise:
- Microcracks without an electrical effect. If the crack does not yet disturb the current flow, no heat is produced. That requires electroluminescence or a characteristic-curve measurement.
- General ageing. A module that has evenly lost ten per cent of its power is thermally inconspicuous.
- Faults in the inverter, the cabling and the monitoring. At most the consequence is visible, not the cause.
- Everything beneath the module surface in detail. The camera sees the outer skin; the heat source may lie a few millimetres below it and therefore appears blurred.
- The remaining service life. A hot module is a finding, not a forecast.
The conditions decide the value of the flight
A thermal flight in the wrong weather delivers images but no statement. Four quantities determine whether the survey is robust:
- Irradiance, at least 600 watts per square metre. Below that, the temperature differences are too small to separate a defect from the noise.
- Load, the plant is feeding in and is not curtailed.
- Wind, as little as possible. Wind cools the module surface and levels out precisely the differences that matter.
- Viewing angle and reflection. Glass reflects. That is why the flight is vertical and the sun angle is chosen so that the camera does not measure the reflection of the sky.
An example from our own practice: on the reference flight the irradiance lay between 547 and 683 watts per square metre, so the first rows were just below the limit. That is stated as such in the report, and since then we set 600 watts as the lower limit for every flight instead of simply pushing the flight through.
Radiometric or not
An ordinary thermal camera delivers a false-colour image: you can see that something is warmer, but not how warm. A radiometric camera stores a temperature value for every pixel. Only that makes it possible to define thresholds, to compare modules with one another and to make the evaluation verifiable.
We fly radiometrically and evaluate every module against its neighbours in the same row, not against a fixed absolute value. That removes effects which affect the whole row, such as cloud during the overflight.
What is delivered in the end
The flight produces a radiometric thermal orthophoto of the whole plant, over it a module grid, and from that a list of findings: for each finding the module ID, the coordinate, the maximum temperature, the temperature difference to the row, the class of the pattern and a priority. As a PDF for the records, as CSV and GeoJSON for the maintenance software.
The prioritisation is the real benefit. A list of three hundred findings with no ranking is worthless for maintenance; a list that says which twenty modules are due this week is not.
Figures from the reference project
A ground-mounted plant with 2.8 megawatts of peak power on the High Rhine, surveyed at the end of August 2026. The operator is not named, at their own request; all figures come from the delivered report:
- around 4'900 modules according to the register, 22 rows, 2.2 hectares
- 75 minutes of thermal flight, 1'805 images, 5 centimetres per pixel
- 325 conspicuous modules, that is seven per cent of the plant
- of these 126 at priority one, 172 at priority two, 27 at priority three
- 118 of the 126 urgent findings confirmed in at least two raw images
- 92 per cent of all findings in rows 11 to 22, a spatial pattern that makes the follow-up check targeted
- four modules reached the camera's measuring limit of 150 degrees and were reported as minimum values
The last point is typical of honest thermography: where the camera reaches its limit, that is stated in the report instead of inventing a figure.
What the report is not
It is not a test according to IEC TS 62446-3 and not a conclusive assessment. It is a systematic, documented survey with prioritised suspected cases. Classification, thresholds and the conditions of the flight are set out openly in it, so that the findings remain verifiable and the qualified electrician knows where to start measuring.
That is precisely where the value lies: not in a diagnosis from the air, but in the fact that nobody has to walk three hundred modules any more in order to find twenty.
How a project runs, which fixed price applies to which plant size and what is in the data package is set out on the solar thermography page.
Frequently asked questions
- In what weather can you fly?
- What is needed is at least 600 W/m² of irradiance, a plant under load and little wind. In Switzerland that means April to September between roughly 10 and 16 hours, under a clear sky. Thin veil cloud pushes the irradiance below the limit, and strong wind cools the modules and makes hotspots disappear. That is why we set the date at short notice according to the weather and not on spec.
- Does the plant have to be running during the flight?
- Yes. A hotspot arises because a defective cell turns the string current into heat instead of power. If the plant is at a standstill, no current flows and the fault stays cold and therefore invisible. A curtailed inverter or a shutdown during the survey makes the flight worthless.
- Does the thermal camera detect microcracks?
- Only if the crack is already affecting the cell electrically and therefore generating heat. A fresh microcrack that does not disturb the current flow stays thermally invisible. That requires electroluminescence, which works in the dark and with an applied voltage, or a characteristic-curve measurement on the string.
- Does the report replace a test according to IEC TS 62446-3?
- No. We deliver a systematic, documented survey with prioritised suspected cases, not a normative test and not a conclusive assessment. Classification, thresholds and conditions are set out openly in the report, so that your qualified electrician can follow the findings and re-measure them in a targeted way.
- How often is a survey worthwhile?
- For plants in yield operation, an annual rhythm has proved itself, ideally always in the same time window. The value lies in the comparison: a module that was at priority 3 this year and at priority 1 next year is a different signal from a single finding with no history.